Kappa
“Great things are not done by impulse, but by a series of small things brought together.”
Hack The Box
Anomaly Detection
Anomaly detection, also known as outlier detection, is crucial in unsupervised learning. It identifies data points that deviate significantly from normal behavior within a dataset. These anomalous data points, often called outliers, can indicate critical events, such as fraudulent activities, system failures, or medical emergencies.
Think of it like a security system that monitors a building. The system learns the normal activity patterns, such as people entering and exiting during business hours. It raises an alarm if it detects something unusual, like someone trying to break in at night. Similarly, anomaly detection algorithms learn the normal patterns in data and flag any deviations as potential anomalies.
Anomalies can be broadly categorized into three types:
- Point Anomalies: - Individual data points significantly differ from the rest—for example, a sudden spike in network traffic or an unusually high credit card transaction amount.
- Contextual Anomalies: - Data points considered anomalous within a specific context but not necessarily in isolation. For example, a temperature reading of 30°C might be expected in summer but anomalous in winter.
- Collective Anomalies: - A group of data points that collectively deviate from the normal behavior, even though individual data points might not be considered anomalous. For example, a sudden surge in login attempts from multiple unknown IP addresses could indicate a coordinated attack.
Various techniques are employed for anomaly detection, including:
- Statistical Methods: - These methods assume that normal data points follow a specific statistical distribution (e.g., Gaussian distribution) and identify outliers as data points that deviate significantly from this distribution. Examples include z-score, modified z-score, and boxplots.
- Clustering-Based Methods: - These methods group similar data points together and identify outliers as data points that do not belong to any cluster or belong to small, sparse clusters. K-means clustering and density-based clustering are commonly used for anomaly detection.
- Machine Learning-Based Methods: - These methods utilize machine learning algorithms to learn patterns from normal data and identify outliers as data points that do not conform to these patterns. Examples include One-Class SVM, Isolation Forest, and Local Outlier Factor (LOF).
One-Class SVM
One-Class SVM is a machine learning algorithm specifically designed for anomaly detection. It learns a boundary that encloses the normal data points and identifies any data point falling outside this boundary as an outlier. It's like drawing a fence around a sheep pen – any sheep found outside the fence is likely an anomaly. One-Class SVM can handle non-linear relationships using kernel functions, similar to SVMs used for classification.
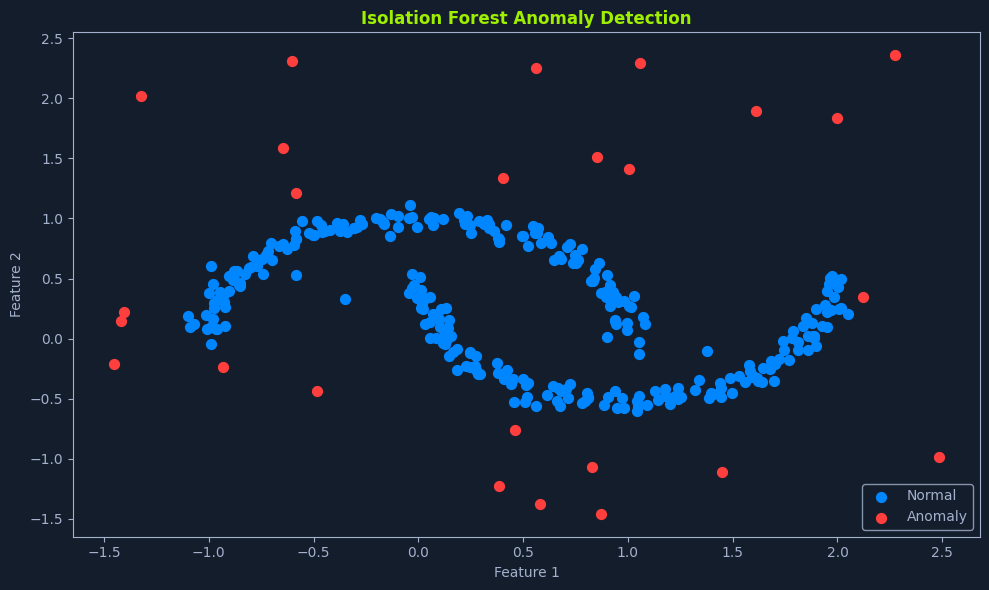
Isolation Forest
Isolation Forest is another popular anomaly detection algorithm that isolates anomalies by randomly partitioning the data and constructing isolation trees. Anomalies, being "few and different," are easier to isolate from the rest of the data and tend to have shorter paths in these trees. It's like playing a game of "20 questions" – if you can identify an object with very few questions, it's likely an anomaly.
The algorithm works by recursively partitioning the data until each data point is isolated in its leaf node. A random feature is selected at each step, and a random split value is chosen. This process is repeated until all data points are isolated.
The anomaly score for a data point is then calculated based on the average path length to isolate that data point in multiple isolation trees. Shorter path lengths indicate a higher likelihood of being an anomaly.
The anomaly score for a data point x is calculated as:
          score(x) = 2^(-E(h(x)) / c(n))

          Where:
            E(h(x)): Average path length of data point x in a collection of isolation trees.
            c(n): Average path length of unsuccessful search in a Binary Search Tree (BST) with n nodes. This serves as a normalization factor.
            n: Number of data points.
Anomaly scores closer to 1 indicate a higher likelihood of being an anomaly, while scores closer to 0.5 indicate that the data point is likely normal.
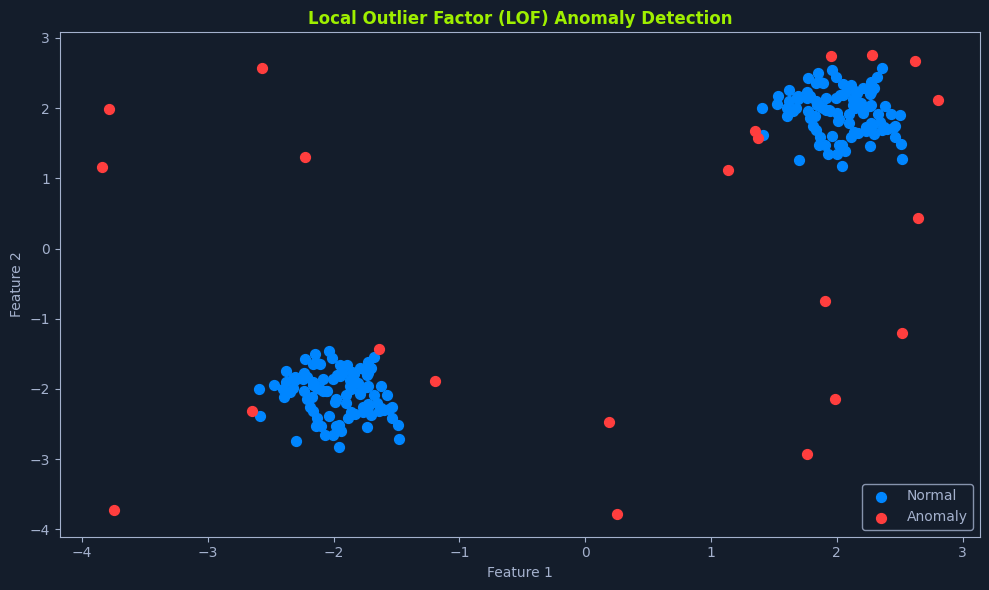
Local Outlier Factor (LOF)
Local Outlier Factor (LOF) is a density-based algorithm designed to identify outliers in datasets by comparing the local density of a data point to that of its neighbors. It is particularly effective in detecting anomalies in regions where the density of points varies significantly.
Think of it like identifying a house in a sparsely populated area compared to a densely populated neighborhood. The isolated house in a region with fewer houses is more likely to be an anomaly. Similarly, in data terms, a point with a lower local density than its neighbors is considered an outlier.
The LOF score for a data point p is calculated using the following formula:
          LOF(p) = (Σ lrd(o) / k) / lrd(p)

          Where:
            lrd(p) : The local reachability density of data point p.
            lrd(o) : The local reachability density of data point o, one of the k nearest neighbors of p.
            k : The number of nearest neighbors.
Higher LOF scores indicate a higher likelihood of a data point being an outlier.
Local Reachability Density
The local reachability density (lrd(p)) for a data point p is defined as:
          lrd(p) = 1 / (Σ reach_dist(p, o) / k)

          Where:
            reach_dist(p, o): The reachability distance from p to o, which is the maximum of the actual distance between p and o and the k-distance of o.
The k-distance of a point o is the distance to its kth nearest neighbor. This ensures that points in dense regions have lower reachability distances, while points in sparse regions have higher reachability distances.
Data Assumptions
Anomaly detection techniques often make certain assumptions about the data:
- Normal Data Distribution: - Some methods assume that normal data points, such as Gaussian distribution, follow a specific distribution.
- Feature Relevance: - The choice of features can significantly impact the performance of anomaly detection algorithms.
- Labeled Data (for some methods): - Some machine learning-based methods require labeled data to train the model.
Anomaly detection is a critical task in data analysis and machine learning, enabling the identification of unusual patterns and events that can have significant implications. By leveraging various techniques and algorithms, anomaly detection systems can effectively identify outliers and provide valuable insights for decision-making and proactive intervention.
Fundamentals of AI
- Introduction to Machine Learning
- Mathematics Refresher for AI
- Supervised Learning Algorithms
- Linear Regression
- Logistic Regression
- Decision Trees
- Naive Bayes
- Support Vector Machines (SVMs)
- Unsupervised Learning Algorithms
- K-Means Clustering
- Principal Component Analysis (PCA)
- ~ Anomaly Detection
- Reinforcement Learning Algorithms